

Extras
Below you can see a rough estimation of the coverage of the Blitzortung.org lightning detection network. NOTE: Only the density of detector station is considered here, not their constellation which is even more important.
Feel free to participate in our high resolution lightning detection network! You can build up stations almost everywhere in the world! More information on Blitzortung.org -> Cover Your Area.
The Coverage Map
-
Blue ( 150-500km ) - Most important color!
Best range for our stations to detect lightning. Dark blue stands for a good coverage, with high accuracy and good detection efficiency. Light blue means, that we could need some additional stations around this area. With more stations in or around blue areas we will get higher detection efficiency. -
Red ( 500-2000km )
Areas covered only by far stations. The accuracy is not so good and we catch only about 10-20% of all strikes there (especially those with high power). This is already very good, but for higher accuracy and detection efficiency more stations in these areas are needed. -
Yellow ( >2000km )
Almost the same as red. We catch some lightnings in this area, but not everywhere. With more stations there, we could dramatically increase the coverage in this areas. -
Green ( < 150km )
These areas have a very high station density. Even weak strokes can be detected.
Additional Notes
In the map above, up to four circles with different sizes and colors are painted around every currently active station. If the colored areas overlap, the visibility of the colors gets better. If you enter a ratio, the mean longtime ratio for each station will be used and stations that don't reach this ratio are not included. Please note: This map is only a very rough estimation to show our station coverage and the projection is not exact! For real coverage, we also have to consider the angle between all station for each point on the map.
Comparison with lightning densities
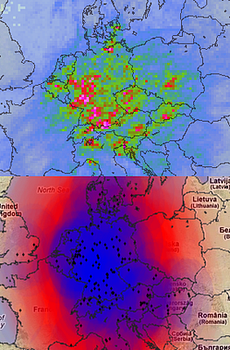 On the left side you can see a comparison of the coverage (top) with our calculated lightning densities for the year 2011 (bottom).
The highest lightning densities were calculated in the same regions, that have a very high station coverage.
If you look on France, you can see an increase of lightning density from west to east.
This is also visible in the coverage picture.
Conclusion: We need more stations in uncovered regions to catch more lightnings there!
Currently, calculation of lightning densities does only make sense in blue areas.
On the left side you can see a comparison of the coverage (top) with our calculated lightning densities for the year 2011 (bottom).
The highest lightning densities were calculated in the same regions, that have a very high station coverage.
If you look on France, you can see an increase of lightning density from west to east.
This is also visible in the coverage picture.
Conclusion: We need more stations in uncovered regions to catch more lightnings there!
Currently, calculation of lightning densities does only make sense in blue areas.
Accuracy and detection efficiency
When we want to compare our calculated data with the reality, we have to consider two parameters:
- Accuracy: How good are the calculated positions? We compare our data with free data from commercial lightning detection networks. In dark blue regions, the accuracy is already very good. Another very impressive possibility is described here.
- Detection efficiency: The percentage of real lightnings. When we compare our data with data of commercial lightning detection networks, then we can see that the detection efficiency is much lower outside the "blue" region. With more stations, we could detect much more lightning strikes there.
Ratio
If you enter a ratio, only circles to stations with higher detection ratios in that range are painted into the map. You should concentrate on the blue color, so disable the other colors if you enter a ratio.


